Gantt Chart
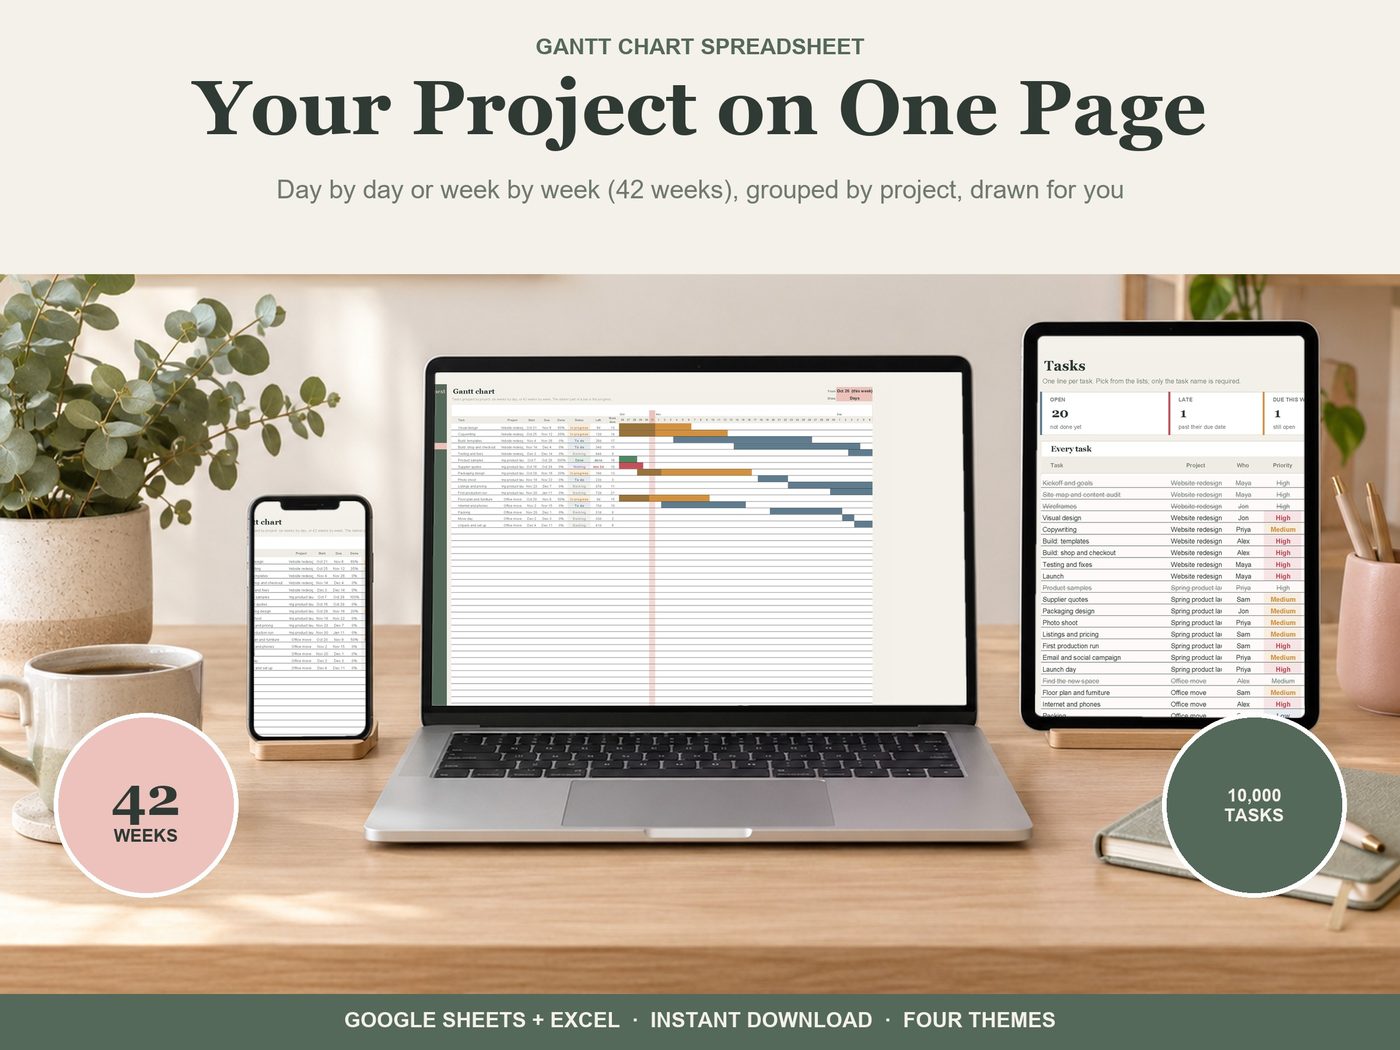
Give each task a start and a due date. The chart draws itself. Works in Google Sheets (free) and Excel 365.
Get it on EtsyGoogle Sheets (free) and Excel 365 · Four themes · Instant download · Works on phone and tablet in the Google Sheets app
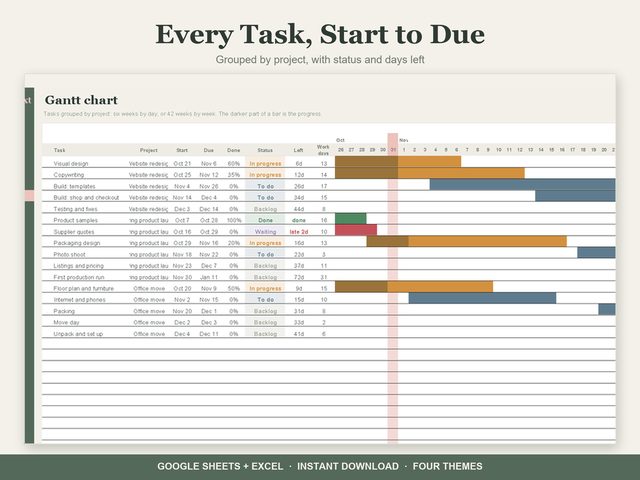
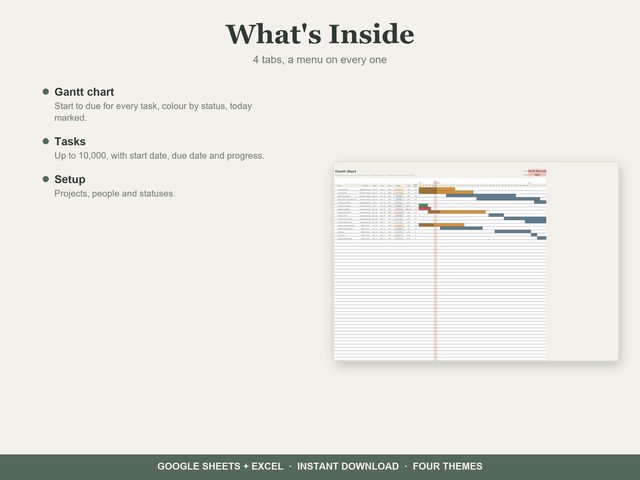
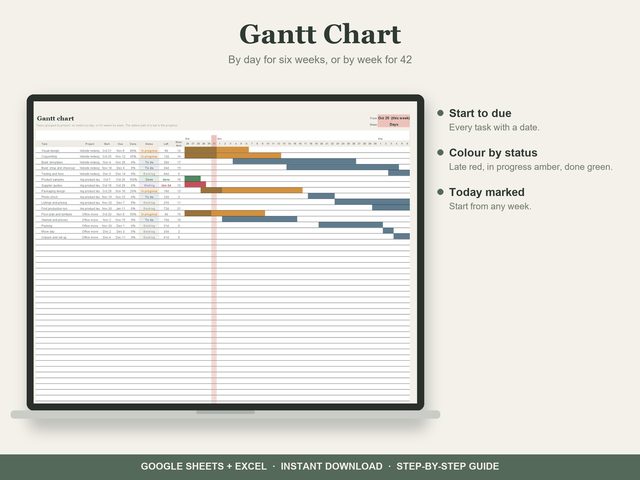
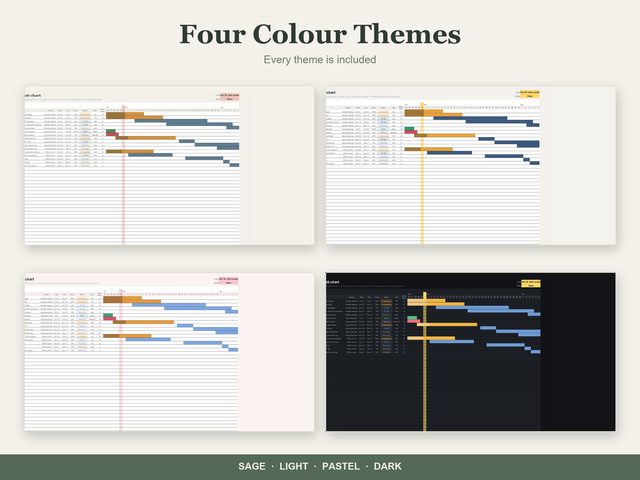
- Gantt chart: task bars grouped by project, six weeks by day or 42 weeks by week, start from any week
- Colour by status: to do, in progress, done, late in red. The darker part of a bar is the progress
- Status, days left and work days (Mon to Fri) for every task; today's column marked
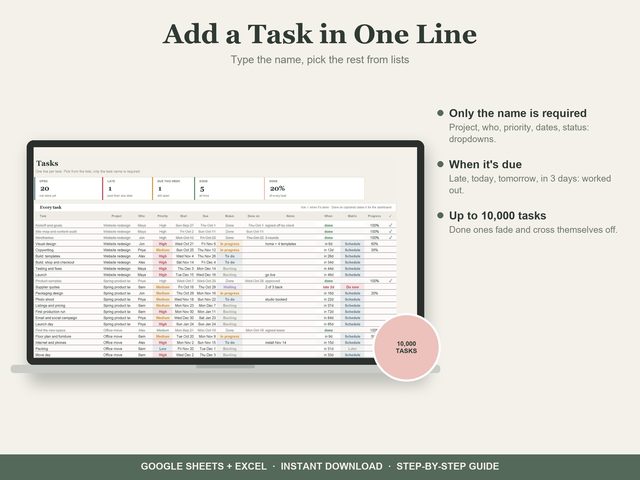
- Tasks: up to 10,000, with project, person, priority, dates, status and progress
How you get it
1Buy on Etsy
Checkout, receipts and reviews stay on Etsy. Your download is ready right after you pay.
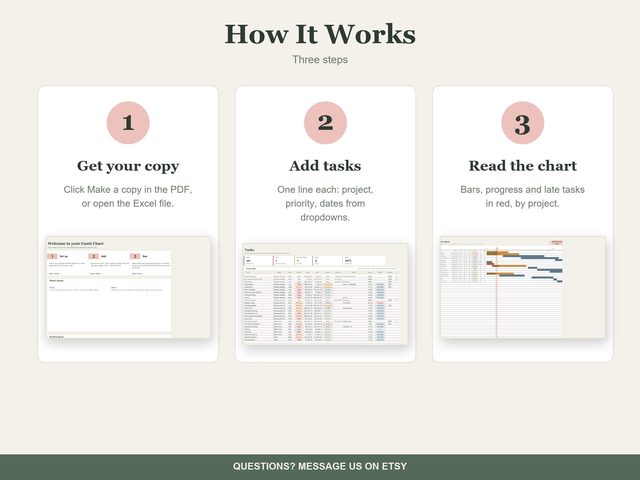
2Make your copy
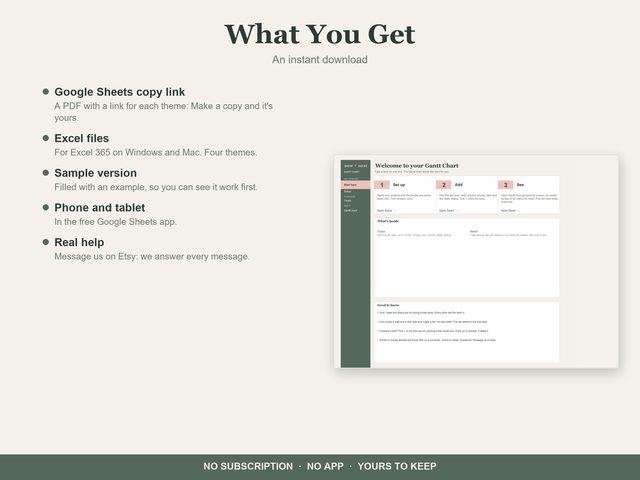
Open the PDF, click a theme's link, then Make a copy. It's yours in your own Google Drive. Prefer Excel? The Excel files are in the download too.
3Type, and watch it fill in
Enter your numbers once. Dashboards, charts and totals work themselves out.
More like this
Planners and Trackers
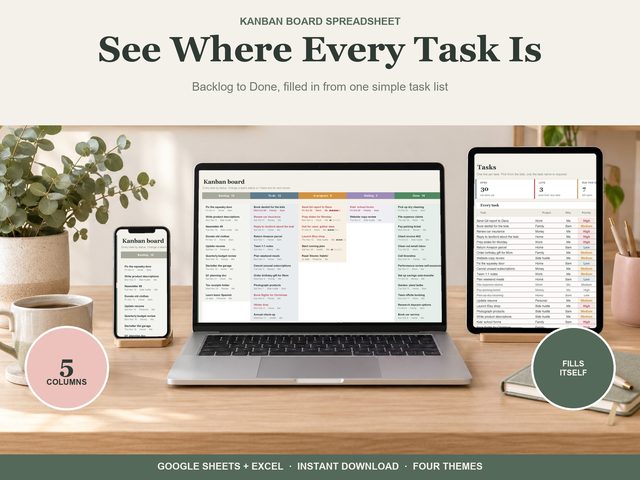 Kanban Board
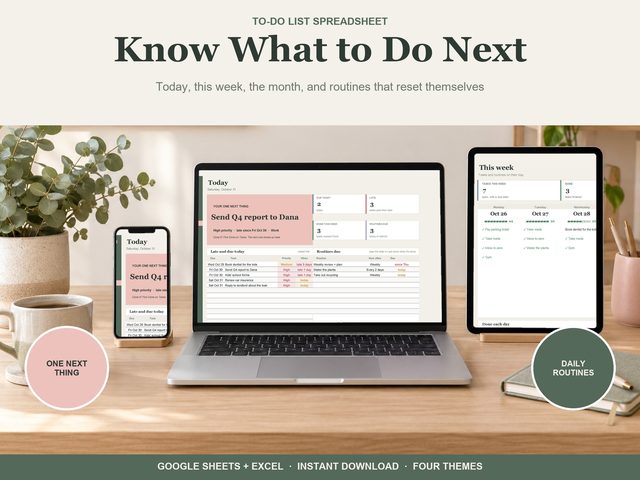 To-Do List