How to track reselling profit per item: the real numbers behind every flip
Count cost, fees, shipping, supplies, mileage and time on every item you resell, with one flip worked through from thrift store to sale.
"Bought it for $12, sold it for $85" sounds like $73 profit. It almost never is. Fees, the shipping label, the mailer and the drive to the thrift store all come out of that sale, and if you don't count them, you can be busy every weekend and wonder where the money went.
Here's how to work out what each flip really made.
What to track for every item
One row per item, from the day you buy it to the day it sells:
- What it cost you. The price you paid, or its share of a lot (more below).
- Where you got it. Thrift, garage sale, estate sale, auction. Over time this tells you which sources pay.
- Dates: bought, listed and sold.
- Platform and sale price.
- Shipping charged to the buyer, if any, and the label cost you paid.
- Other costs: mailer, tape, cleaning, repairs.
- Fees for the platform you sold on.
- Time you spent on it: photos, listing, packing, the post office.
From those, the useful numbers fall out:
- Profit = sale price + shipping charged − label − other costs − fees − cost
- ROI = profit ÷ cost
- Days to sell = sold date − bought date
- Profit per hour = profit ÷ hours spent
Fees: use the current rates
Every platform charges differently: a percentage of the sale, sometimes of the shipping too, plus fixed per-order amounts, payment processing, optional ads, and rates that differ by category. They also change. Keep a small table of the rates you sell under, check each platform's current fee page, and update it when they change instead of carrying a number around in your head.
Lots and bins: split the cost
Buy a box of four jackets for $48 and each jacket's cost isn't zero, and it isn't $48. Split it:
- Evenly: $48 ÷ 4 = $12 each. Simple, and fine when the items are similar.
- By list price: if one jacket will list at $120 and the others at $40, giving it more of the cost is fairer. Total list $240, so the $120 jacket carries half the cost, $24, and each $40 jacket carries $8.
Pick one method per lot and stick to it.
Mileage and sourcing time
Sourcing trips cost money even when you don't buy anything. Log each trip: where, the distance, the time, and what you spent. In Canada and the US, business driving can usually be deducted at a set per-kilometre or per-mile rate. Those rates change, so check the current CRA or IRS rate.
Not tax advice: ask an accountant how your driving and inventory should be reported.
A worked flip
The jacket from that box of four. The trip to the estate sale was 18 km and two hours, and all four jackets came from it. For the example, fees are 13% of the sale plus $0.40, and mileage is $0.70 per km. Both are illustrations only: put in the current rates for your platform and country.
| Line | Amount |
|---|---|
| Sale price (free shipping) | $85.00 |
| Fees: 13% × $85 + $0.40 | −$11.45 |
| Shipping label | −$14.20 |
| Poly mailer | −$0.60 |
| Cost: $48 lot ÷ 4 | −$12.00 |
| Profit on the item | $46.75 |
| Trip share: 18 km × $0.70 ÷ 4 | −$3.15 |
| Profit after the trip | $43.60 |
The rest of the story:
- ROI: $46.75 ÷ $12.00 = 390% on the item; $43.60 ÷ $12.00 = 363% after the trip.
- Time: 30 minutes photographing, listing and packing, plus a quarter of the two-hour trip (another 30 minutes): one hour in total.
- Profit per hour: $43.60 ÷ 1 hour = $43.60 an hour.
- Days to sell: bought and sold 41 days apart.
So the "$73 profit" was really $43.60, and still a good flip.
The flip that only looked good
Now a $20 t-shirt from the same kind of trip, using the same example fee rate:
| Line | Amount |
|---|---|
| Sale price (free shipping) | $20.00 |
| Fees: 13% × $20 + $0.40 | −$3.00 |
| Shipping label | −$9.80 |
| Poly mailer | −$0.40 |
| Cost | −$3.00 |
| Profit | $3.80 |
ROI is $3.80 ÷ $3.00 = 127%, which sounds great. But it took 24 minutes (0.4 hours) to photograph, list and pack, so profit per hour is $3.80 ÷ 0.4 = $9.50. ROI says buy more of these; profit per hour says don't. That's why it's worth tracking both.
What to look at every month
- Profit and profit per hour, after expenses and trips.
- Sell-through: how much of what you list actually sells.
- Best sources and platforms by profit and days to sell.
- Stale stock: what you've had longest and the cash tied up in it. Mark it down, move it to another platform, or donate it and free up the space.
A ledger that does the maths
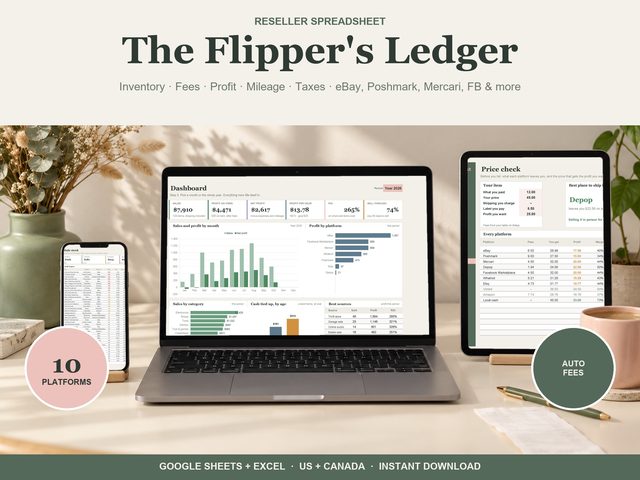
Our Reseller Spreadsheet works this way: one row per item, from the day you buy it to the day it sells. Type the sale price and platform, and fees, profit, ROI and days to sell work themselves out from an editable fee table for eBay, Poshmark, Mercari, Depop, Facebook Marketplace, Whatnot, Etsy, Vinted, Amazon and local cash. Lots split across their items evenly or by list price. The dashboard shows profit per hour, ROI, sell-through and best sources; a stale stock tab suggests markdowns; and trips, expenses and a year-end tax summary are built in. Works in Google Sheets and Excel, in the US and Canada.